As I finished up plotting the CZ-5BR rocket stage, I came across an image containing two hours of stacked images observing Comet 2020 T2. By itself, while interesting, the image of the Comet did not catch my attention. Rather, I focused on the web of satellite streaks across the image. I wanted to determine whether I could identify the specific satellites crossing the camera’s Field of View. To begin, I thought about calculating the comet orbit location.
Of course, I needed the date of the exposure(s), the time of the exposure(s), the altitude, and the Azimuth.
Unfortunately, I did not have the source image and, consequently, did not have the metadata. However, the title to the image indicated that it had been obtained using the Baker-Nunn camera at the University of Calgary Rothney Astrophysical Observatory in Priddis, Alberta. I also had an inference that the image may have been made over the course of the last few days. All of this happened to be speculation as the astronomer could easily be observing from any telescope capable of observing Comet 2020 T2.
Although I inquired about additional information, I decided to begin my exploration while waiting for additional details.
Building from the objective of calculating the comet orbit location, I began by determining the location of Comet 2020 T2 in the night sky.
Skyfield provides a Python routine for obtaining orbital elements for predicting comet positions through the IAU Minor Planet Center. After adding the code, I pulled the database of 943 comets:
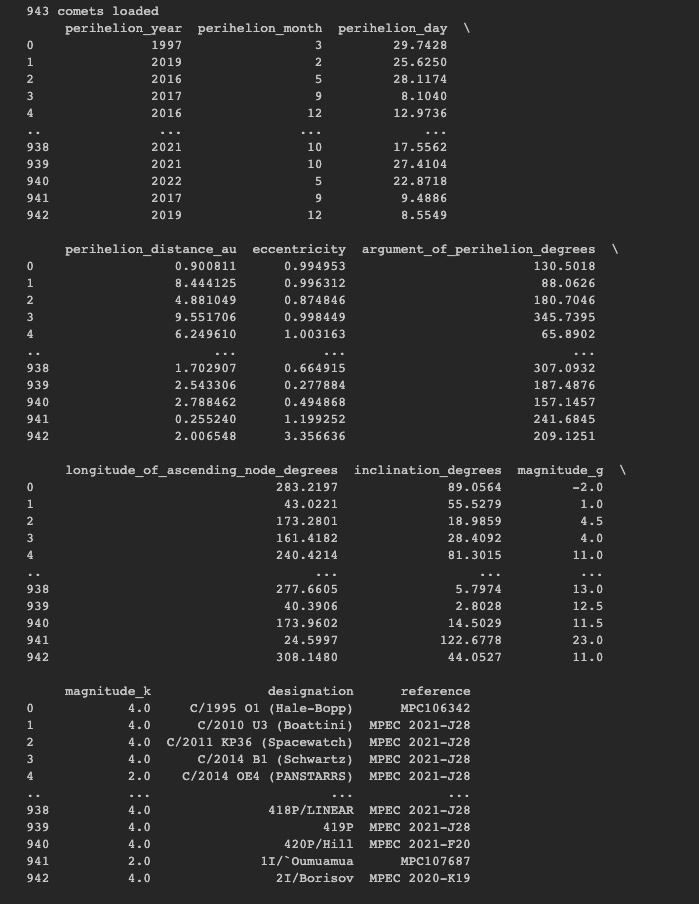
PD of Comet Data
Ad searched for C2020 T2.
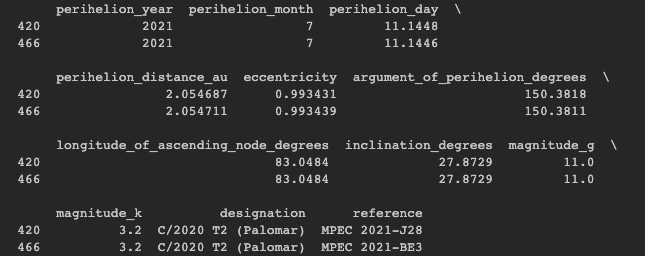
C2020 T2 (Palomar) Data
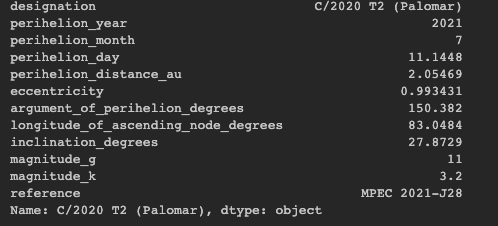
C2020 T2 (Palomar) Data
With this information, we can determine the Right Ascension and Declination of the comet as of a particular date. For May 21, 2021, the RA calculates to be 13h 36m 59.46s and the Declination calculates to be +27deg 09′ 57.2″ which we can plot:
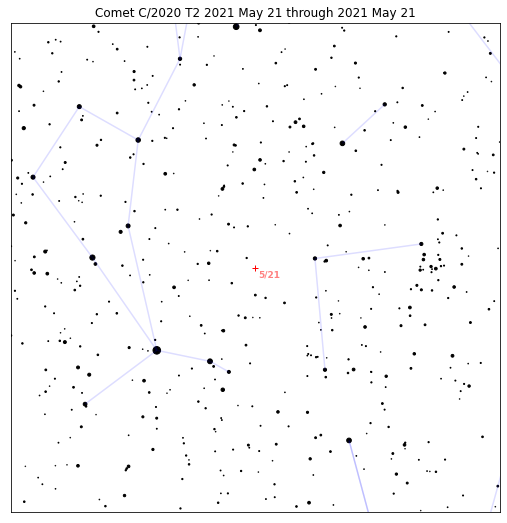
C2020 T2 May 21, 2021
Using the same code, we can also calculate and plot the comet’s position over a course of time. For example, the following plots represent the comet’s path in April 2021 and May 2021.
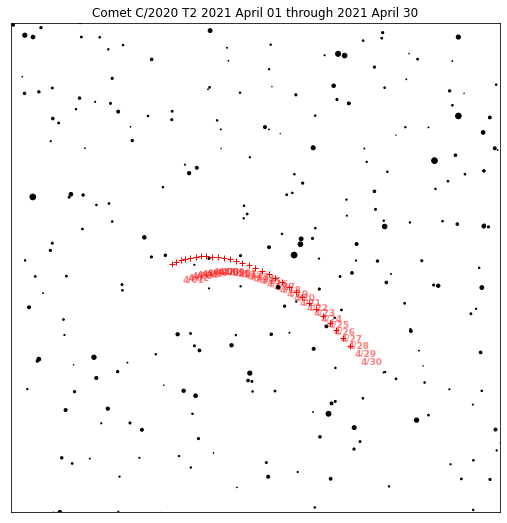
C2020 T2 in April 2021
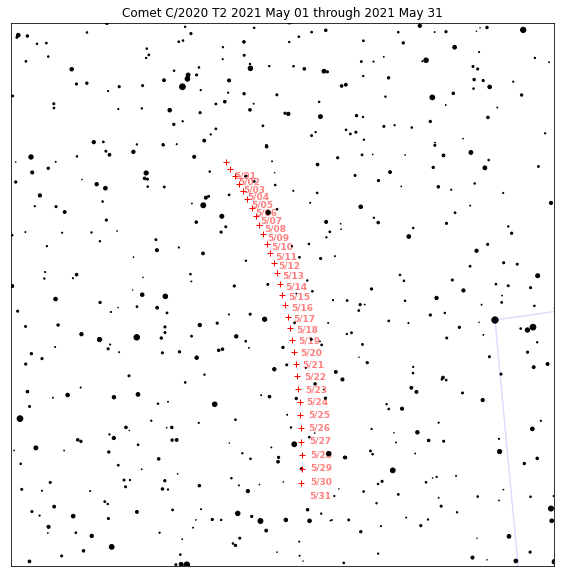
C2020 T2 in May 2021
Next, we need to determine the location of the comet in relation to the observer’s location on Earth. Using Calgary, Alberta, Canada, the latitude is 51.046 degrees and the longitude is -114.065 degrees.
I then ran a script to identify the location of the comet from Calgary as the Earth position on an approximate sunset for May 21, 2021 in Calgary (04:33 UTC) through sunrise the next morning (12:34:59 UTC) for each of the 28920 seconds:
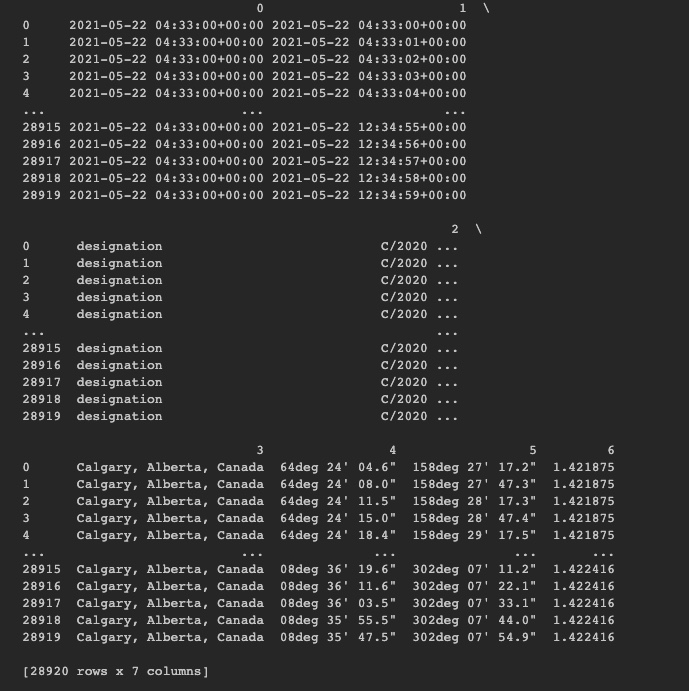
Locations of comet for 8.5 h
But, if we are to run across all sunlit satellites, we really need to narrow down the scope of time. Though my MacBookPro operates fast, it’s not that fast to also allow other work. So, I will work to narrow the time frame and possibly have the code operate on a separate computer.
(More to come; credit to the author of the initial code forthcoming).
