In my continuing effort to identify the specific satellites traversing the Baker-Nunn image of M3 and C2020 T2 from the University of Calgary, I further M3/C2020-T2 satellite plots by shifting to using RA/Dec over AzAlt. (More generally, the Baker-Nunn camera has a long association with satellites.)
But, as I learned in my prior efforts, a balance exists in working through the compiled database of approximately 4400 satellites (I use TLE for Active, Last 30 Days, Starlink, and Starlink Supplemental; combine them; and, remove duplicates) and running every one of the 7200 seconds in 2 hours of observation time. At the moment, I run the combined database for every 15 seconds across a wide enough field (“Wide Field”) that will capture any satellite crossing the Baker-Nunn field of view (about 4/5 degrees). Then, after obtaining a limited database of just those satellites that fall within the Wide Field, I obtain the plots for every satellite for every second.
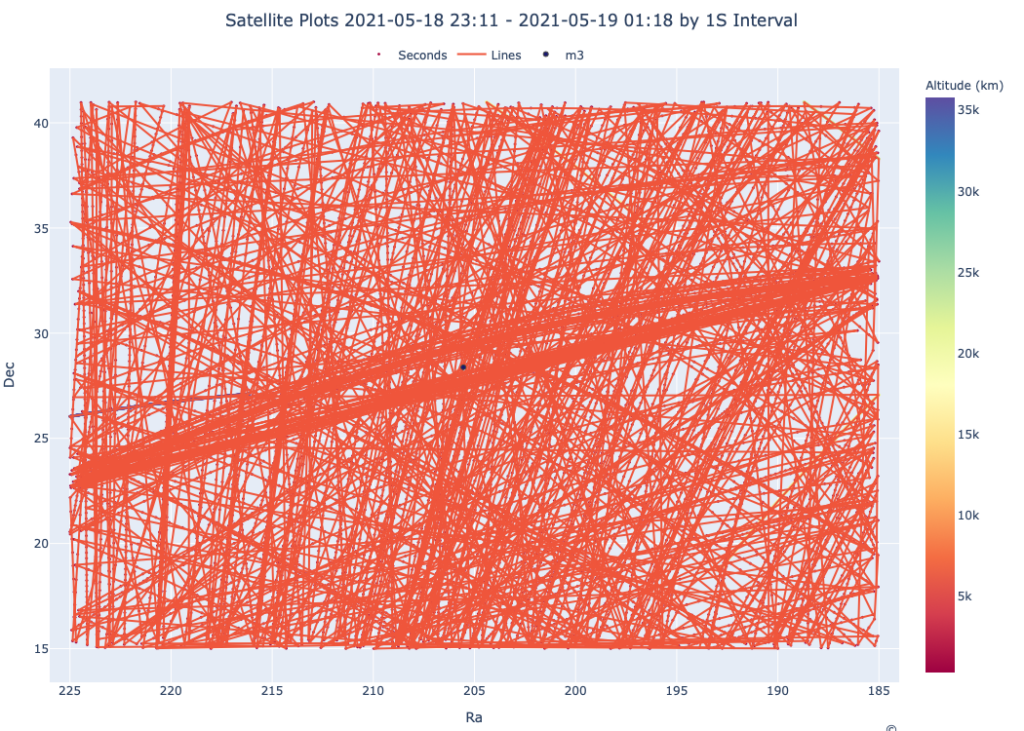
This resulted in the following plot (be sure to click the image for the interactive plot):
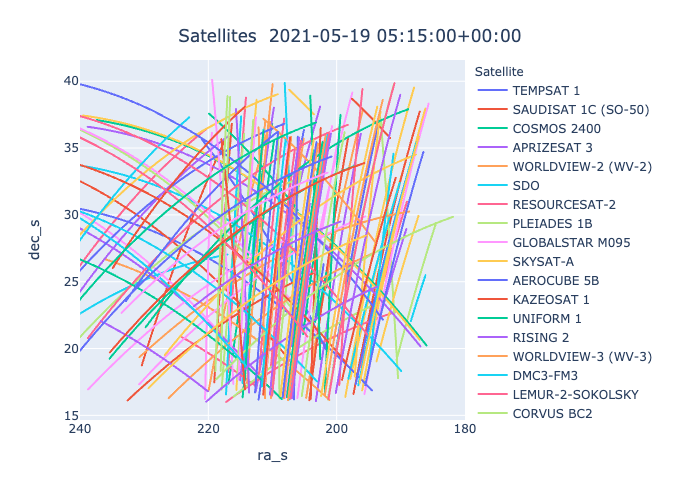
Wide RA Dec Plots
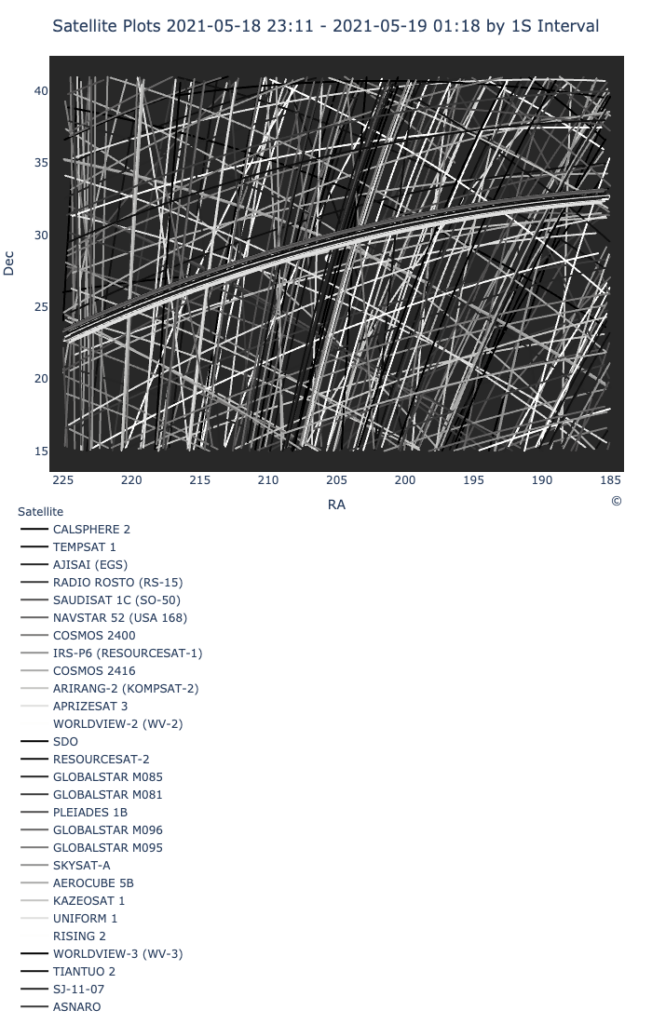
Limiting the plot to the apparent Baker-Nunn FOV, we obtain (please note that the list of satellites on the right in the image and plot below corresponds to the complete set of satellites above):
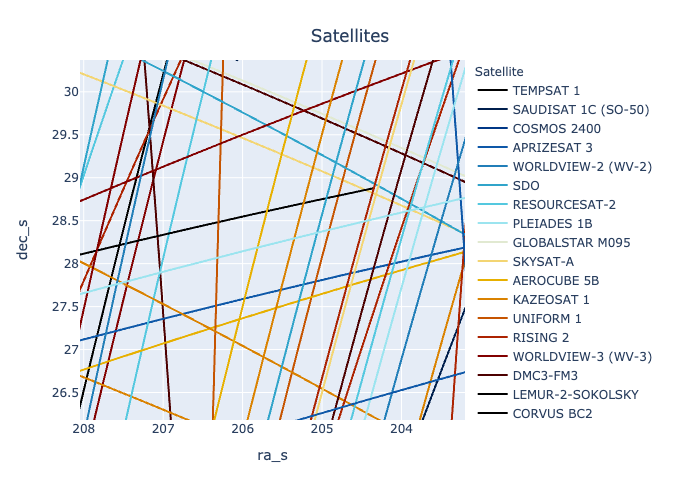
FOV RA Dec Plots
(Click Image for Interactive Plotly Plot)
Although I used a sunlit parameter, it may very well be that not all satellites traversing the FOV could be seen. Thus, the satellites listed in the plots above will not necessarily all be observed in the Baker-Nunn photograph.
For demonstrative purpose and comparing to the further M3/C2020-T2 satellite plots, I repost the Baker-Nunn photograph:
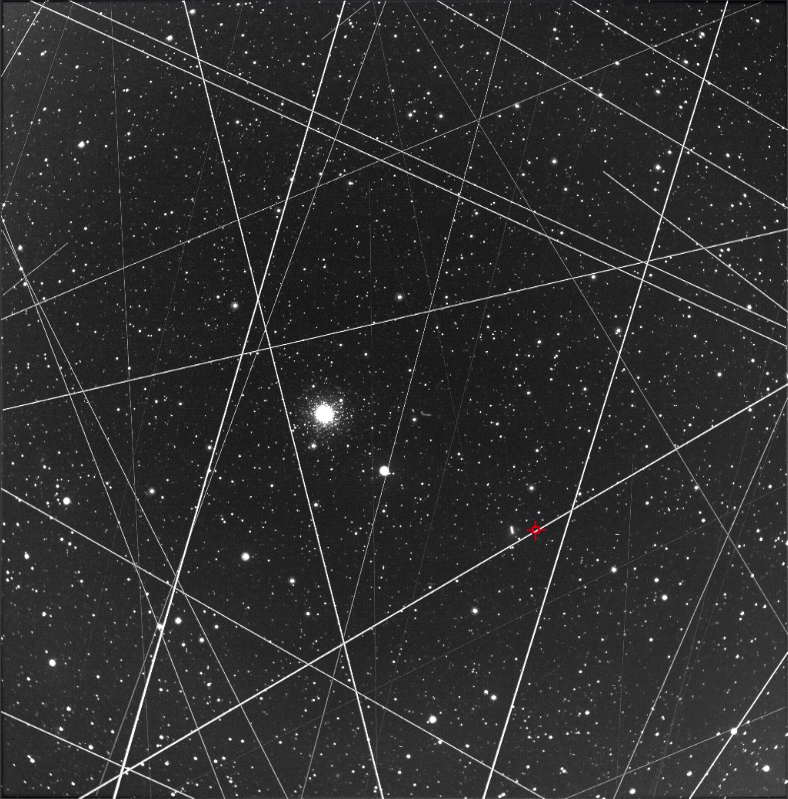
M3
Ra 13h 43m 11.1s OR 205.7958 (est, as .1 not included)
Dec 28˚16’18.5″ OR 28.2717 (est. as .5 not included)
Image courtesy of Prof. Phil Langill, Univ. Calgary.
Update 2021-06-12
I began to collect the TLE previously obtained over a significant period of time and place them in a Dropbox folder that I can access from any of my devices. So, I now have TLE pretty close to the dates at issue (e.g. May 22, 2021 for Active).
I also reviewed the time frame of the capture and determined that there exist a few minutes on either end of the two hour window I omitted. These missing minutes will now be included.
So, the current code will use the closest TLE from three sources and include the entire time frame of the image capture. It will be interesting to see if this completes the streak for Starlink-1266.
The new processing will use the elevation and determine at what orbit the satellite happens to be. For what it’s worth, I ran a max() across the elevation column and one of the satellites (not necessarily in the Baker-Nunn FOV [see above] exceeds 35,000 km. So, I include <LEO, LEO, MEO, GEO, and HEO categories.
Update 2021-06-15
Having been working on this and other TLE projects for some time, I collected a number of TLE files from particular dates. So, I collected these files on a Dropbox folder that the code can access. It finds the closest TLE data to the date at issue, here May 18, 2021-May 19, 2021, from three sources. So, using TLE data closer to the applicable dates, I replotted the satellites. I also made some other additional improvements in code and style.
(On the plots below, I need to determine why the line color differs than the plot color. I also may work on the height and width ratios.)
As mentioned above, the color in the line plot above does not accurately reflect the altitude.
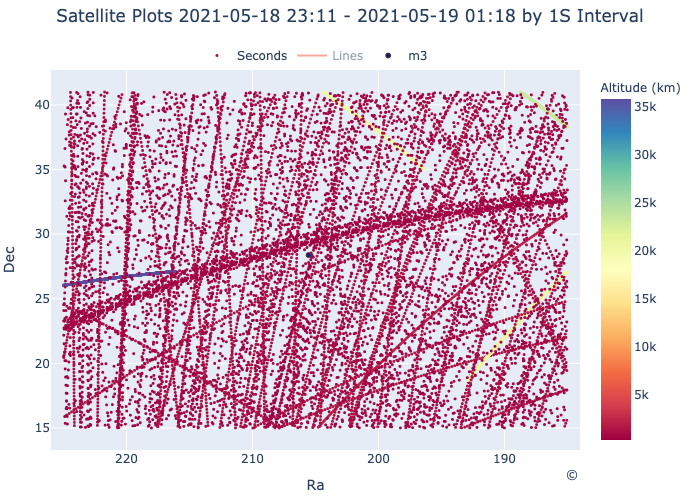
Plots over ~ 2 hours
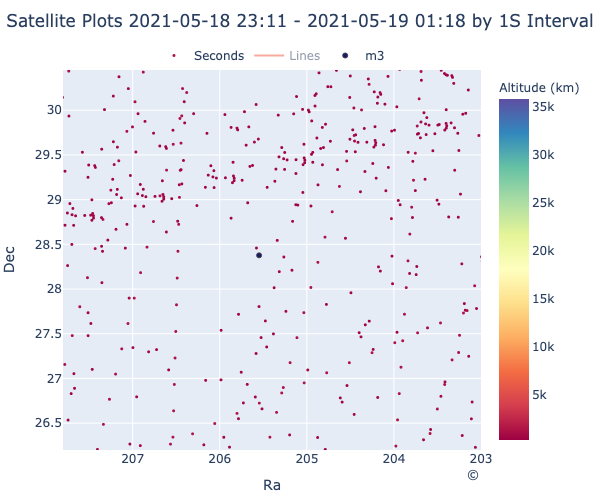
I ran the code over the perceived FOV for the time period at issue. The “Seconds” represent a satellite at a particular point in time for that satellite. The lines will show all satellites orbit lines that came into the FOV over the two hour period. The color represents the altitude in km.
Once I obvtained the proper plots, I then tweaked the code such that each satellite could be highlighted and changed the background to more reflect the Baker-Nunn dark sky.
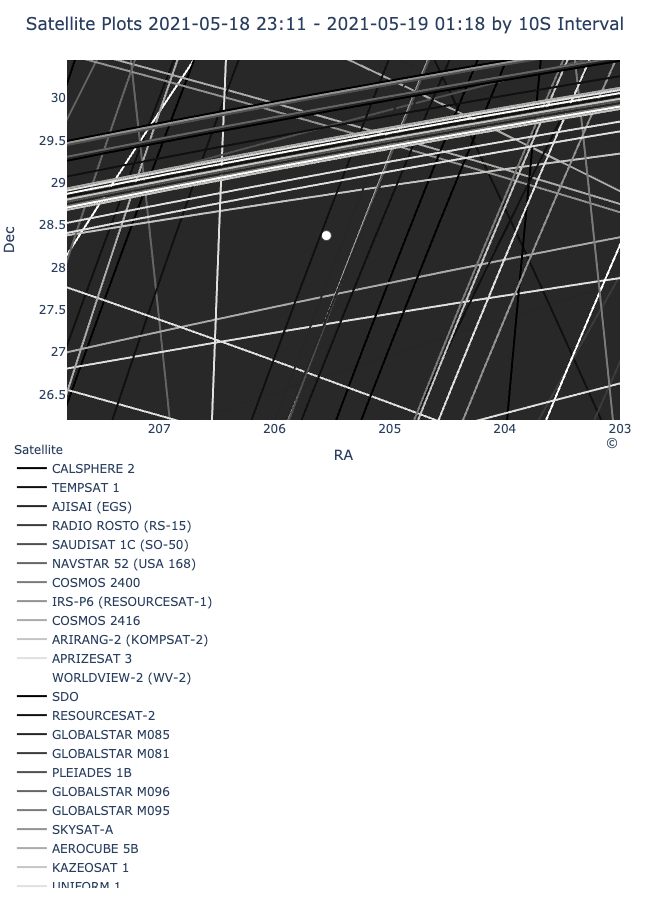
Plot on Dark Background
With slightly changed code in the same notebook, I obtained fig2 which more closely correlates in color to the actual Baker-Nunn photo. Each satellite can be highlighted (or de-highlighted). I am working on the color scheme for the satellites (eg so black is not black). It would be great to make some color calculation based on distance. But, this would need to abut against using Satellite as a color choice.
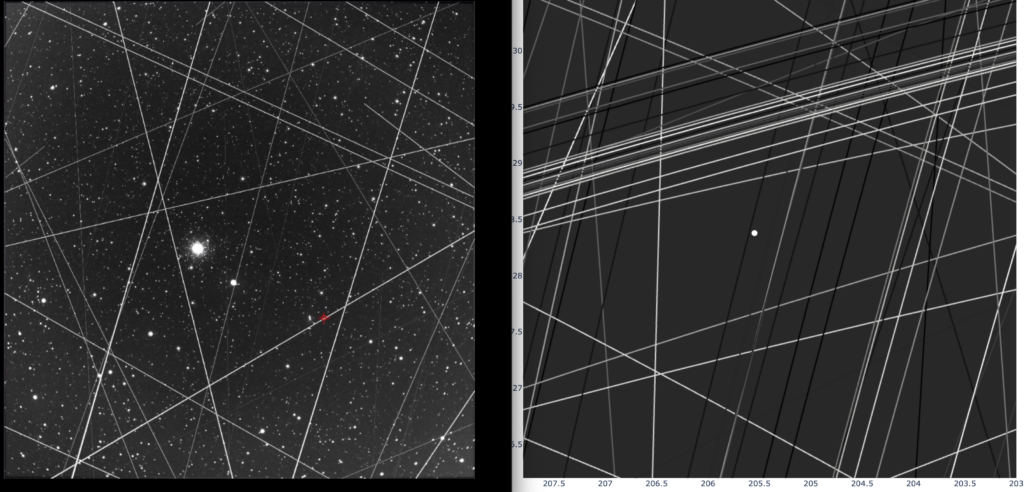
(note the astronomical object in the plot is M3 not the M6.22 star to M3’s right).
Next steps (as of 2021-06-16 2:00 am CT):
(1) I need to return to ephemeris TLE data pulled closer to the date so that we do not use current TLE data for a more accurate picture (this weekend, as working on pulling previously saved TLE data and long processing time) Done.
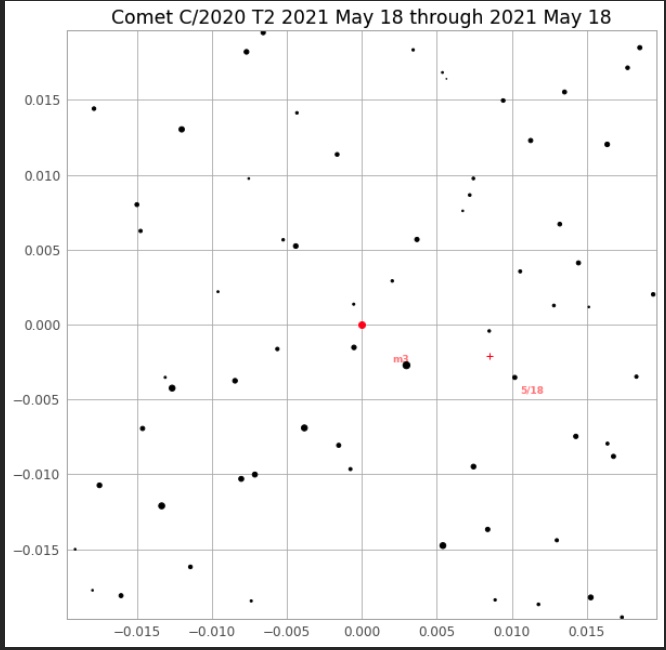
(2) Add in M3 and C2020 locations on the plot (should be tonight or this weekend, convert to go. and update trace).
(3) Explore use of the prior plots of stars so that we recreate the actual image (same as (2)).
See:
(4) Increase the size of the image plot (done in interactive format).
(5) Add in orbit (LEO, MEO, GEO) based on elevation of satellites. Done, see Plot on Dark Background.
(6) Limit FOV satellite list to just those in block.
(7) Add orbit on other plots.
