By way of brief background, I began on a project to identify Starlink satellites photobombing DECam images of the dark sky while taking a course with Alex Drlica-Wagner at the University of Chicago. Since this course concluded, I intend to continue working on an aspect of that project. And, I have been doing so.
But, in the interim, I received and graciously accepted an invitation to join esteemed colleagues as part of a working group for SATCON2. Within the Slack channel, one of my colleagues posted an image obtained from Phil Langill at the University of Calgary containing satellite photobombs of a two hour stack from the Baker-Nunn observing M3 and Comet 2020 T2 (Palomar):
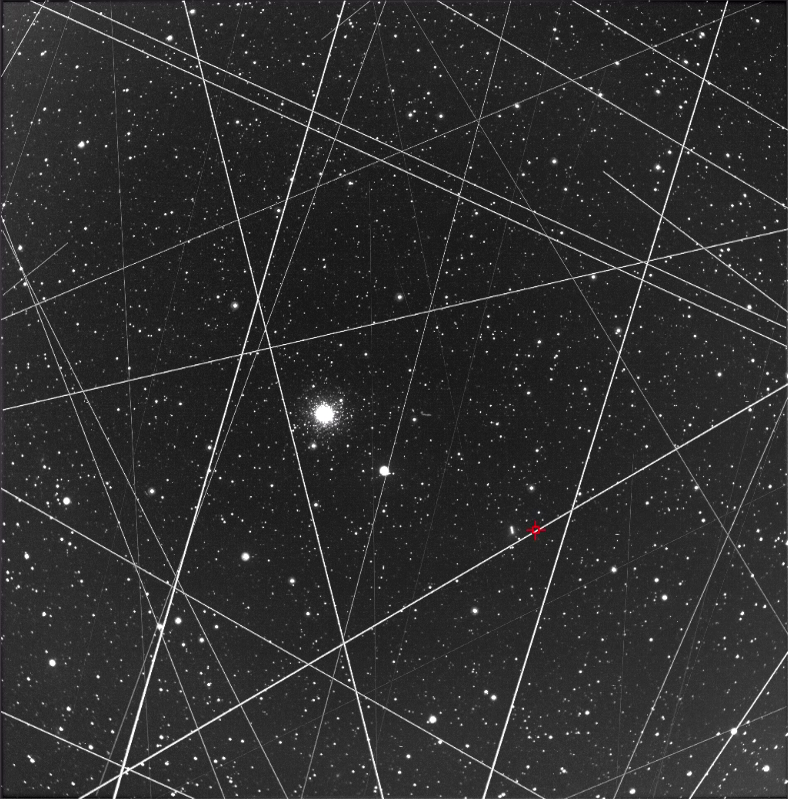
M3 | C2020 T2 (Palomar)
Courtesy Dr. Phil Langill
Director, Rothney Astrophysical Observatory
University of Calgary
Baker-Nunn
Used with permission.
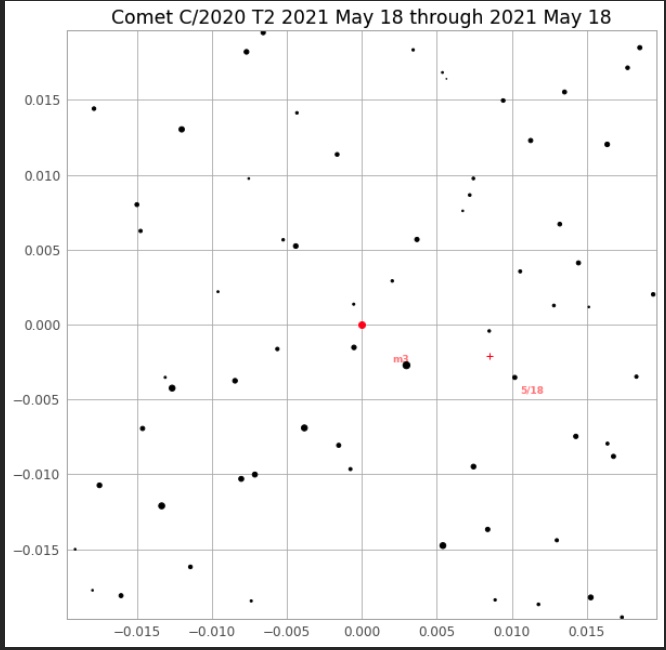
Challenged by my own sense of adventure, I sought to determine the satellites appearing across the image. To begin with, I needed obtain code that would identify the position of M3 and C2020 T2. My most recent post discussed some of this work. Essentially, using the Skyfield package, I employed a Skyfield example plot written to obtain a map to find Neowise. I modified it to (a) identify M3 and C2020 T2 from Alberta, Canada at the applicable time (May 18-19) and (b) frame the portion of the sky in the Baker-Nunn image:
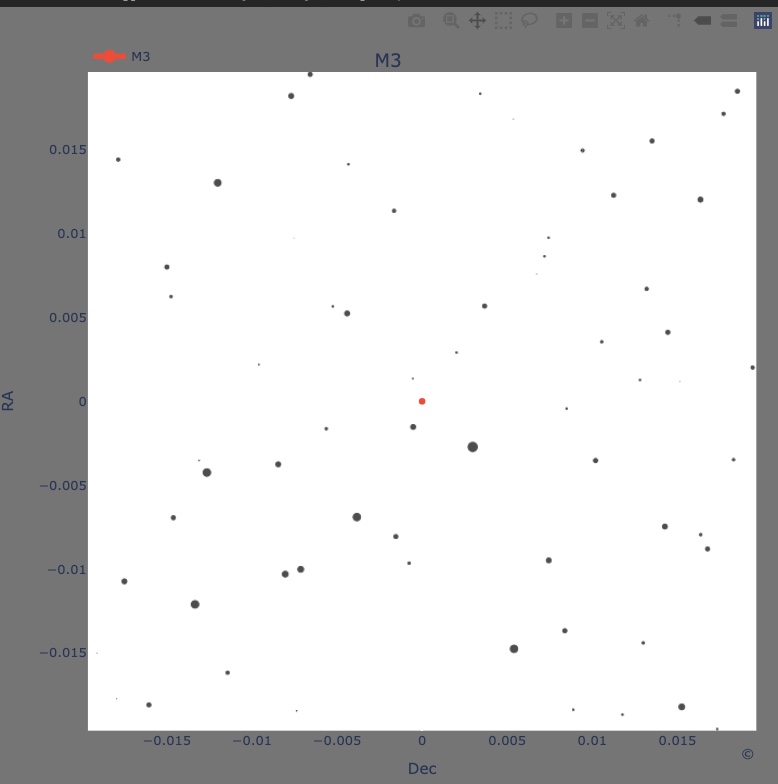
The example plot used Matplotlib. As a recent convert to Plotly, I decided to work on modifying the code to plot the stars using Plotly. After some work, I succeeded.
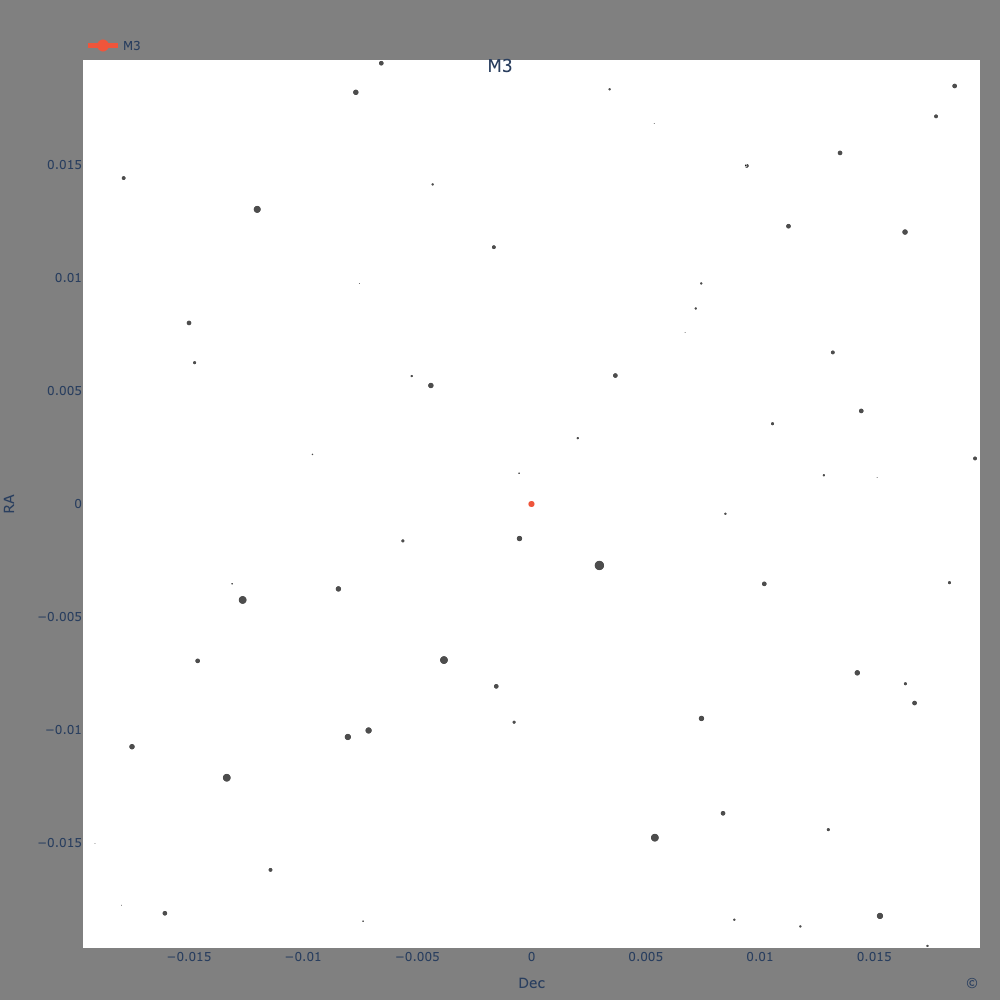
Plotly Stars Centered on M3
Broader Magnitude

Plotly Stars Centered on M3
Limited Magnitude
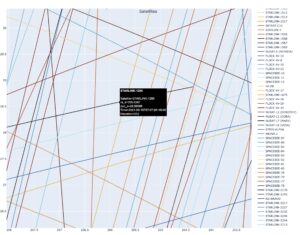
At the same time, I also used code I previously wrote to calculate the position of the satellites. In the past, I merely ran the code to plot satellites for – at most – several minutes. After modifying the code, I began the run that completed after about 3.5 days (yes, since, I determined a much faster means of obtaining the same result). Fortunately, I could use one of my older MacBookPros. In any case, I obtained a plot of satellite trajectories over a wide Azimuth span and a course of two hours.
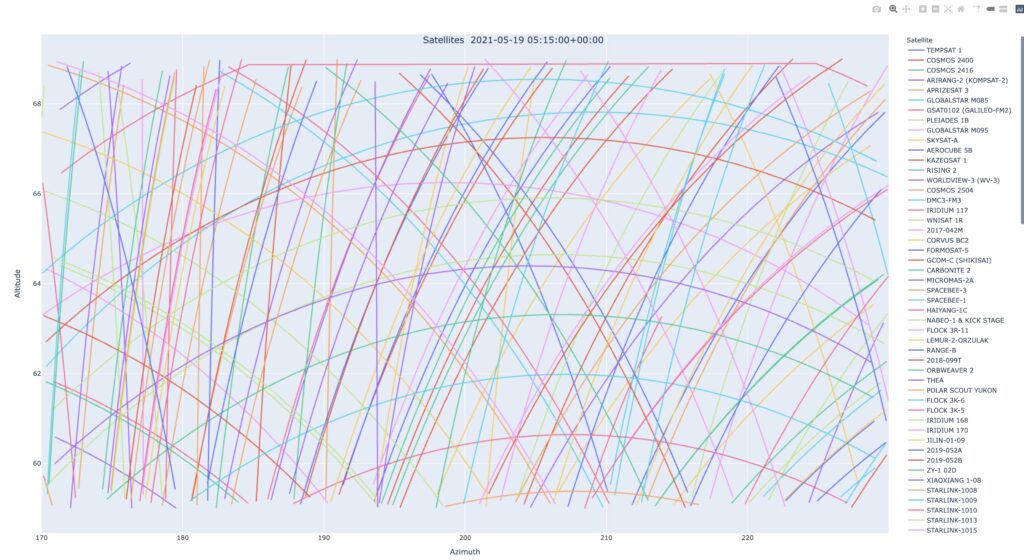
Plot of Select Satellite Orbits
At this juncture, I developed a different method for selecting the applicable satellites. I experimented with the interval at which the code would determine whether the satellite happened to be within the frame (Azimuth and Altitude). I quickly determined that anything above one minute would not sufficiently capture all of the potential satellites. Though, certainly, the number of satellites in the TLE began to match those above as I shortened the interval. At 1 minute intervals over a course of 2 hours, I captured approximately 240 satellites. This represents nearly a 10-fold increase over a 5 minuted interval.
Examining the time stamp for certain satellites traveling North-South or South-North, some satellites traversed the 10 degrees of altitude in approximately 15 seconds. Rather than reduce the interval to 15 seconds, I increased the altitude span additional 10 degrees to a total of 20 degrees. In this way, I could run a calculation for each satellite every 30 seconds and be likely to capture every satellite crossing the N-S orbit space during the time frame. I also made sure to widen the azimuth range to account for the field of view on either side of M3 as it crossed the night sky.
The foregoing being said, some of the satellites in the lower Azimuth range only appear for around 14 seconds. So, it will need to be determined whether the increased range will enable nearly all to be captured. If not, I will reduce the interval to every 15 seconds.